
Tools for Coastal Management
Tools help users accomplish common tasks. In the case of Coastal Atlas tools we've assembled links to a variety of tools designed to help different types of coastal users answer questions that are common in coastal areas. In addition, we are constructing a series of Oregon topic-specific coastal tools. These include tools for beach access and water quality information, as well as shoreline photo viewing tools.
 The Oregon Explorer uses the power of today’s cutting edge information technology to create a state-of-the-art web-accessible natural resources digital library by accessing and integrating data from state and federal agencies, local governments, university scientists and citizens to support informed decisions and actions by people concerned with Oregon’s natural resources and environment. The Oregon Explorer is a project of the OUS Institute for Natural Resources and Oregon State University Library.
 The NANOOS Visualization System (NVS), is a tool for easy access to data. NVS gathers data across a wide range of assets such as buoys, shore stations, and coastal land-based stations. Never before available downloads and visualizations are provided in a consistent format. This tool makes it possible to access plots and data for almost all in-situ assets for the previous 30-day period.
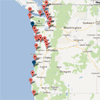
 The Oregon Coastal Access Inventory is a detailed and accurate description of all public beach access points in Coastal Oregon. Under state mandate the public must have access to it's beaches and the local counties (where appropriate) are obligated to provide and maintain such access.
 The Oregon Beach Monitoring Program (OBMP) monitors selected Oregon coastal recreation waters for the presence of fecal bacteria, and reports elevated levels to the public. The OBMP is funded by a grant from the Environmental Protection Agency, is administered by the Department of Human Services and collaborates with Oregon Department of Environmental Quality, and the Oregon Parks and Recreation Department.
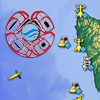
 The Department of Product and Systems engineering Design at the University of the Aegean (Greece) has developed an interesting service called MarineTraffic. The system provides information about the current geographical positions of ships. The provided information on a ships position and identity originate directly from the ships themselves, which transmit this information through public radio frequencies using the ‘Automatic Identification System’ (AIS).
 NOAA Tides & Currents is delivered by NOAA's Center for Operational Oceanographic Products and Services, and provides access to the national infrastructure, science, and technical expertise to monitor, assess, and distribute tide, current, water level, and other coastal oceanographic products and services that support environmental stewardship and environmental assessment and prediction.
 The NOAA Office of Coast Survey's Historical Map & Chart Collection contains over 20,000 maps and charts from the late 1700s to present day. The Collection includes some of the nation's earliest nautical charts, hydrographic surveys, topographic surveys, geodetic surveys, city plans and Civil War battle maps. The Collection is a rich primary historical archive and a testament to the artistry of copper plate engraving technology of the nineteenth and twentieth centuries.
 The Ocean Motion website provides resources developed for inquiring minds both in and outside the classroom, for reading level grades 9-12. Included is a comprehensive review of the surface circulation of Earth’s ocean and classroom investigations appropriate for various disciplines at the high school level.
 Climate change is causing global sea levels to rise. Oregon’s coastlines are vulnerable to the impacts of sea level rise. The Oregon Coastal Management Program (OCMP) has developed several tools to assist local communities in planning for the impacts of sea level rise, including an Impacts Explorer, an Impact Assessment Tool, and a Sea level Planning Guide.
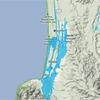
 The Ocean Shores Data Viewer was designed for Oregon’s local planners, state agencies and others working on coastal land-use issues to view, overlay, evaluate, and interact with digital ocean shores data more efficiently. This Viewer provides access to the statewide Goal 18 Beachfront Protection Structure (BPS) eligibility inventory, as well as the existing BPS inventory. Other coastal datasets are also included in this Viewer, such as tsunami inundation areas, coastal erosion hazard zones, and FEMA flood mapping.
 The Estuary Data Viewer was designed to meet the needs of Oregon’s local planners working in and around estuaries. The goal of the viewer is to make estuary related data easier to find and allows users to view, overlay, evaluate, and interact with digital data more efficiently. The viewer supports tasks related to statewide planning Goals 16 and 17 and local estuary management plans.
 The Oregon land use planning online training is an overview of planning principles and practices in Oregon. The purpose of this program is to help citizens and decision-makers have a greater understanding of Oregon’s Statewide Planning and Coastal Management programs and how they relate to local government planning efforts. The curriculum has nine chapters. Users may follow at your own pace and access the program at any point.
 Oregon MarineMap is a web-based tool for open and participatory spatial planning in the marine environment. It was developed to support Goal 19 of Oregon's Statewide Planning program which requires the state "to conserve marine resources and ecological functions for the purpose of providing long-term ecological, economic, and social value and benefits to future generations."
 Oregon is currently engaged in a variety of ocean planning and management activities that will affect the future of its ocean ecosystem and economy. This website will helps Oregonians learn about these activities and about opportunities to be involved. The site maintains a calendar of upcoming ocean events, links to the latest editions of publications and announcements, and information about planning processes that affect Oregon’s ocean areas.
 The Critical Facilities Flood Exposure Tool provides an initial assessment of a community’s critical facilities and roads that lie within the 1% annual chance flood zone established by the Federal Emergency Management Agency (FEMA). The tool helps coastal managers quickly learn which facilities may be at risk—providing information that can be used to increase flood risk awareness or to inform a more detailed analysis.
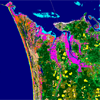 This online data viewer provides user-friendly access to regional land cover and land cover change information developed through NOAA’s Coastal Change Analysis Program (C-CAP). The Land Cover Atlas eliminates the need for desktop geographic information system software, or advanced technical expertise, by processing C-CAP data for the user and providing easy access to that distilled information. The tool summarizes general change trends and can highlight specific changes of interest.
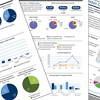 Coastal County Snapshots turn complex data into easy-to-understand stories, complete with charts and graphs. Users select a coastal county of interest and the website does the rest, providing information that can help communities become more resilient to coastal hazards. Local officials can use the snapshots as a planning tool to assess their county’s resilience to flooding and understand the benefits provided by natural resources.
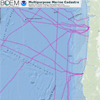 This data viewer provides the baseline information needed for ocean planning efforts, particularly those that involve finding the best location for renewable energy projects. The Multipurpose Marine Cadastre (MMC) is also a helpful tool in the permit review process. Users pick the ocean geography of their choosing and quickly see the applicable jurisdictional boundaries, restricted areas, laws, critical habitat locations, and other important features.
 NOAA’s Coastal and Marine Spatial Planning (CMSP) Data Registry is a collection of Web-accessible NOAA geospatial data deemed essential for local, regional, or national-level CMSP processes. Registry data sets are provided in a variety of formats accessible for download, and many can be easily previewed.
 The National Data Bouy Center (NDBC) provides hourly observations from a network of about 90 buoys and 60 Coastal Marine Automated Network (C-MAN) stations to help meet these needs. All stations measure wind speed, direction, and gust; barometric pressure; and air temperature. In addition, all buoy stations, and some C-MAN stations, measure sea surface temperature and wave height and period. Conductivity and water current are measured at selected stations.
 The High Frequency Radar Network (HFRNet) is being developed to manage, distribute, and display in near-realtime, ocean surface currents measured by a distributed network of shore-based HF radar systems. HFRNet provides reliable data telemetry, archiving, and integrated processing for a growing list of near real-time products in a scaleable manner for a growing user community supported by the Integrated Ocean Observing System.
 The Environmental Research Division's Data Access Program aggregates scientific data from diverse local and remote sources and offers a simple, consistent way to download subsets of the data in common file formats and make graphs and maps. In particular ERDDAP enables easy access to oceanographic data from satellites and buoys.
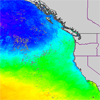
 NOAA's nowCOAST is a GIS-based web mapping portal providing integrated, one-stop access to on-line, real-time coastal environmental observations and NOAA forecasts for any region in the coastal United States. NowCOAST provides users with displays of the latest surface weather and ocean observations, satellite cloud imagery, weather radar reflectivity mosaics, sea surface temperature analyses and gridded forecasts.
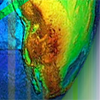
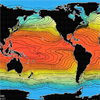 The World Ocean Atlas is a set of objectively analyzed (1° grid) climatological fields of in situ temperature, salinity, dissolved oxygen, Apparent Oxygen Utilization (AOU), percent oxygen saturation, phosphate, silicate, and nitrate at standard depth levels for annual, seasonal, and monthly compositing periods for the World Ocean. It also includes associated statistical fields of observed oceanographic profile data interpolated to standard depth levels on both 1° and 5° grids